Best tools to create software architecture diagrams
There are many tools to create architecture diagrams. In this post, I'll discuss free and paid tools. Some examples are excalidraw, draw.io, lucid.app
As software engineers, our day-to-day work involves creating diagrams to explain the thought process. These diagrams include software architecture, database design & UML diagrams. In this post, I'll discuss different tools available to draw these diagrams.
Software Architecture Diagram Tools
Excalidraw
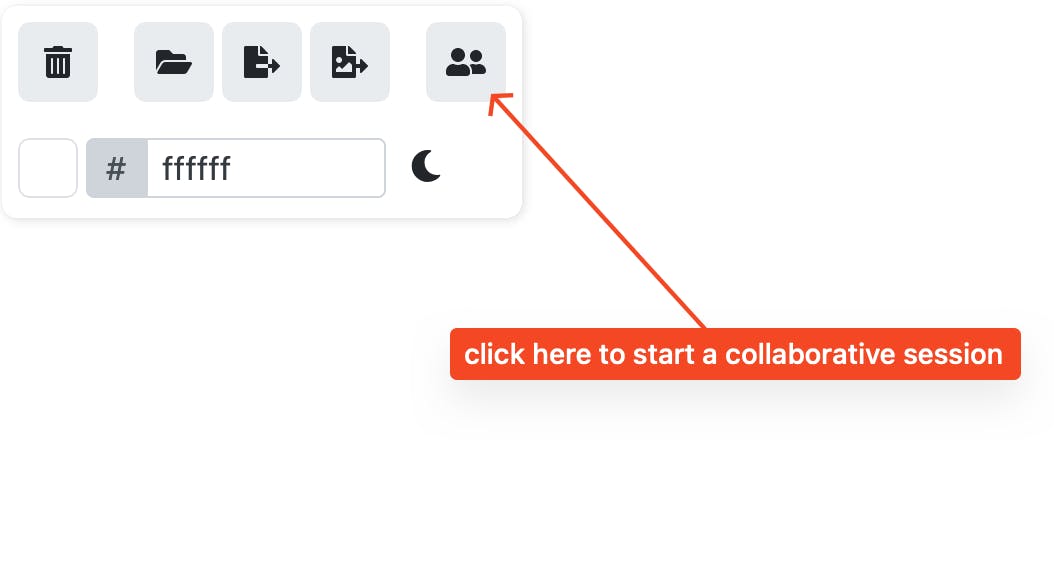
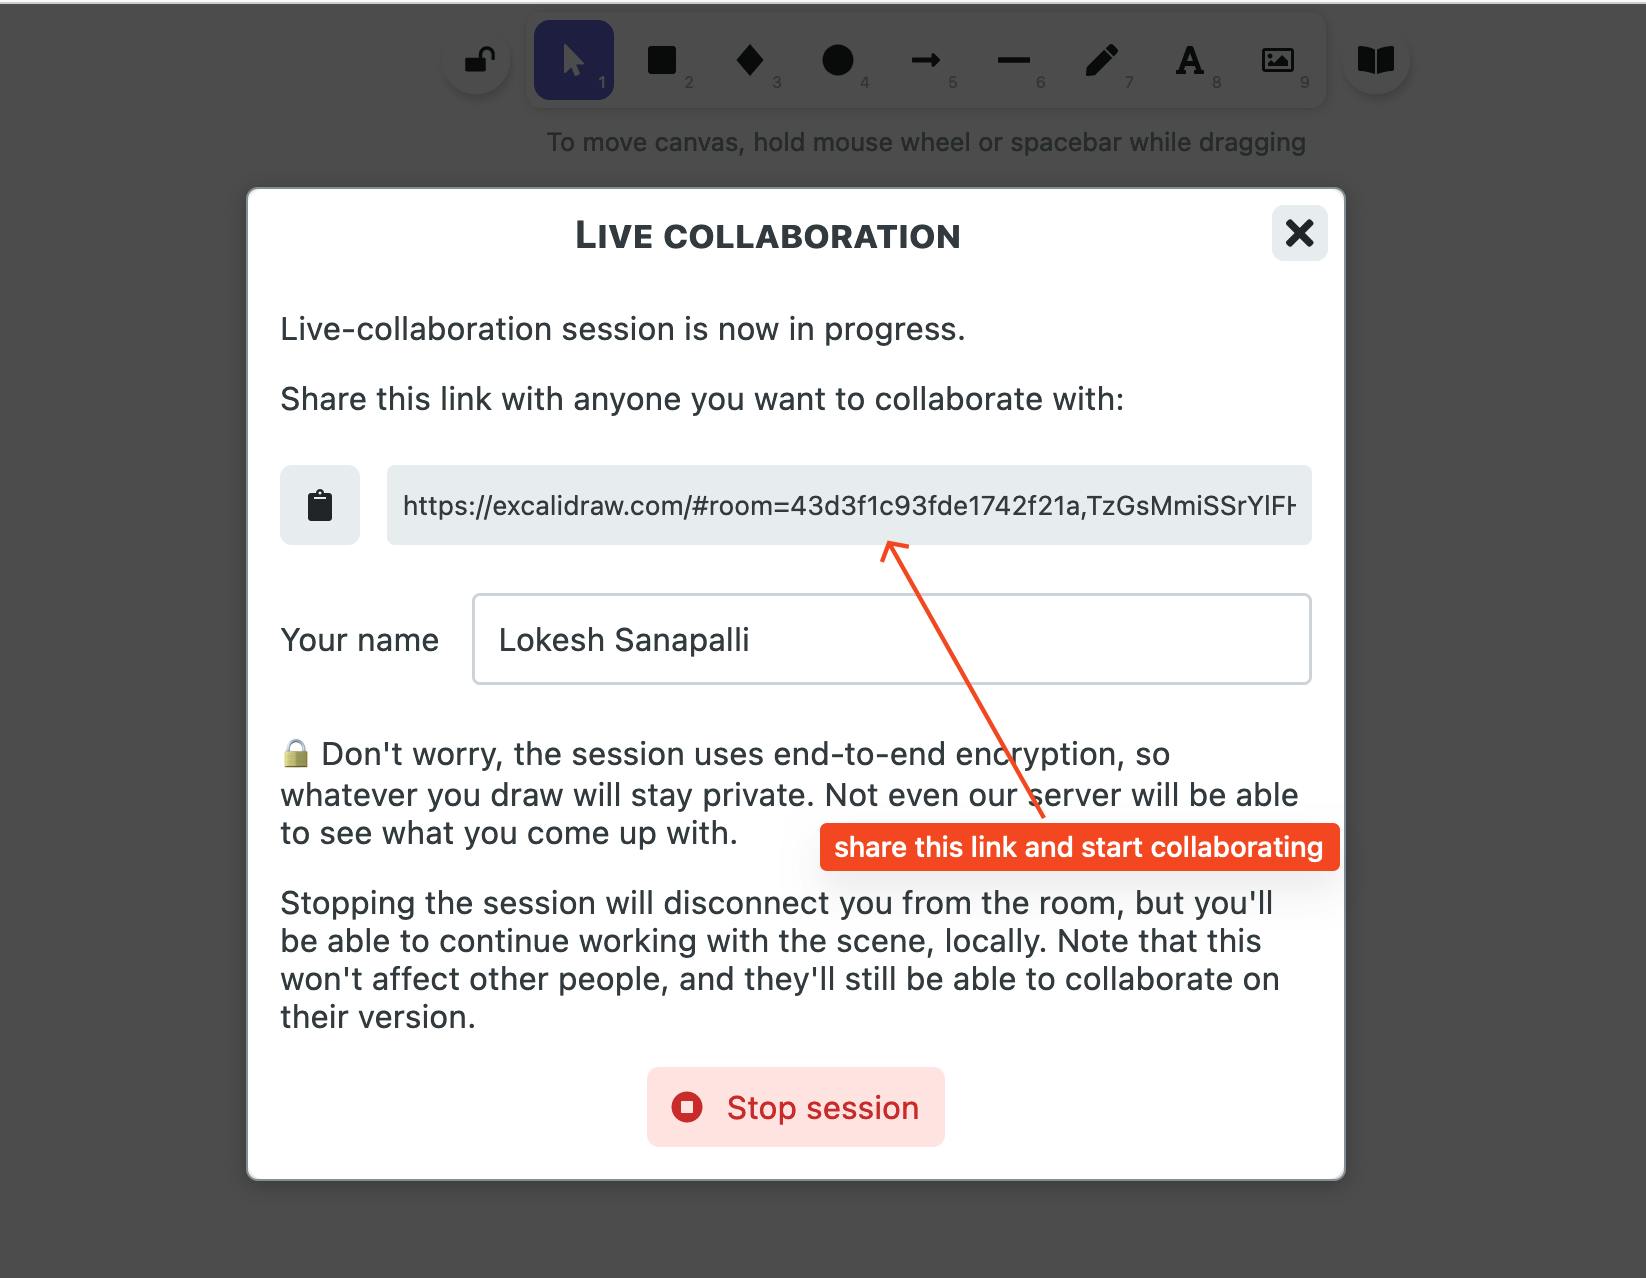
excalidraw.com is one of the emerging tools that started as an open-source. The best part of it is we can use it to collaborate with other people easily.
Pros
- Open-source
- Lot of shapes, tools available and highly customizable
- Easily import and export drawings
- Lot of libraries available
- Able to collaborate with others easily
Cons
- You need excalidraw+ (paid subscription) to save the drawings in the cloud
- To save a diagram, you need to export the
.excalidrawfile and save it by yourself
Adding extra shapes
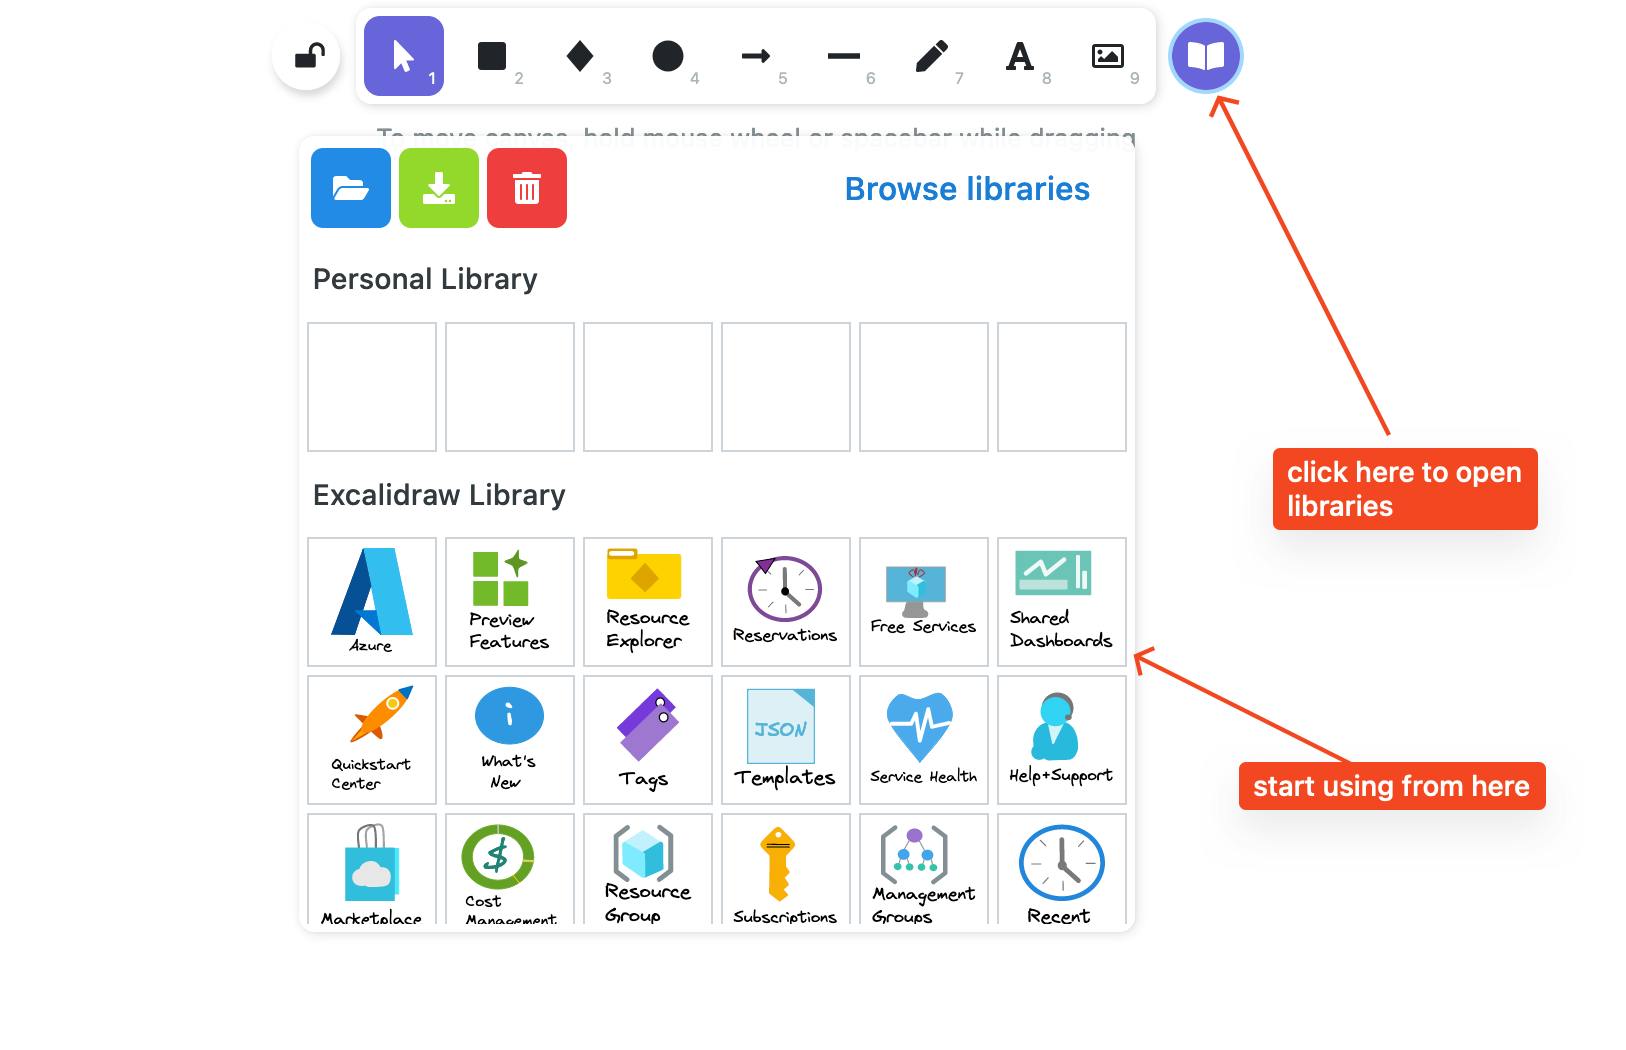
Go to Excalidraw Libraries and just click on "Add to Excalidraw" on any libraries you like.
Here are a few must-have libraries I use.
Once you added them, click on the library icon and start using them (illustrated with the image below)
Live Collaboration
Step 1
Click on the library icon to browse
Step 2
Drag and drop any icon to start using it
Diagrams.net
Diagrams.net (formerly known as Draw.io) has a lot of features that many people are unaware of. I used to think it has only very basic shapes, but after I spent some time and explored, found that there are so many shapes available.
Pros
- Free to use
- Lot of shapes available
- Easily connect with google drive and any cloud storage to backup
- Collaborate with others (requires google drive or one drive account)
Cons
Nothing as of now
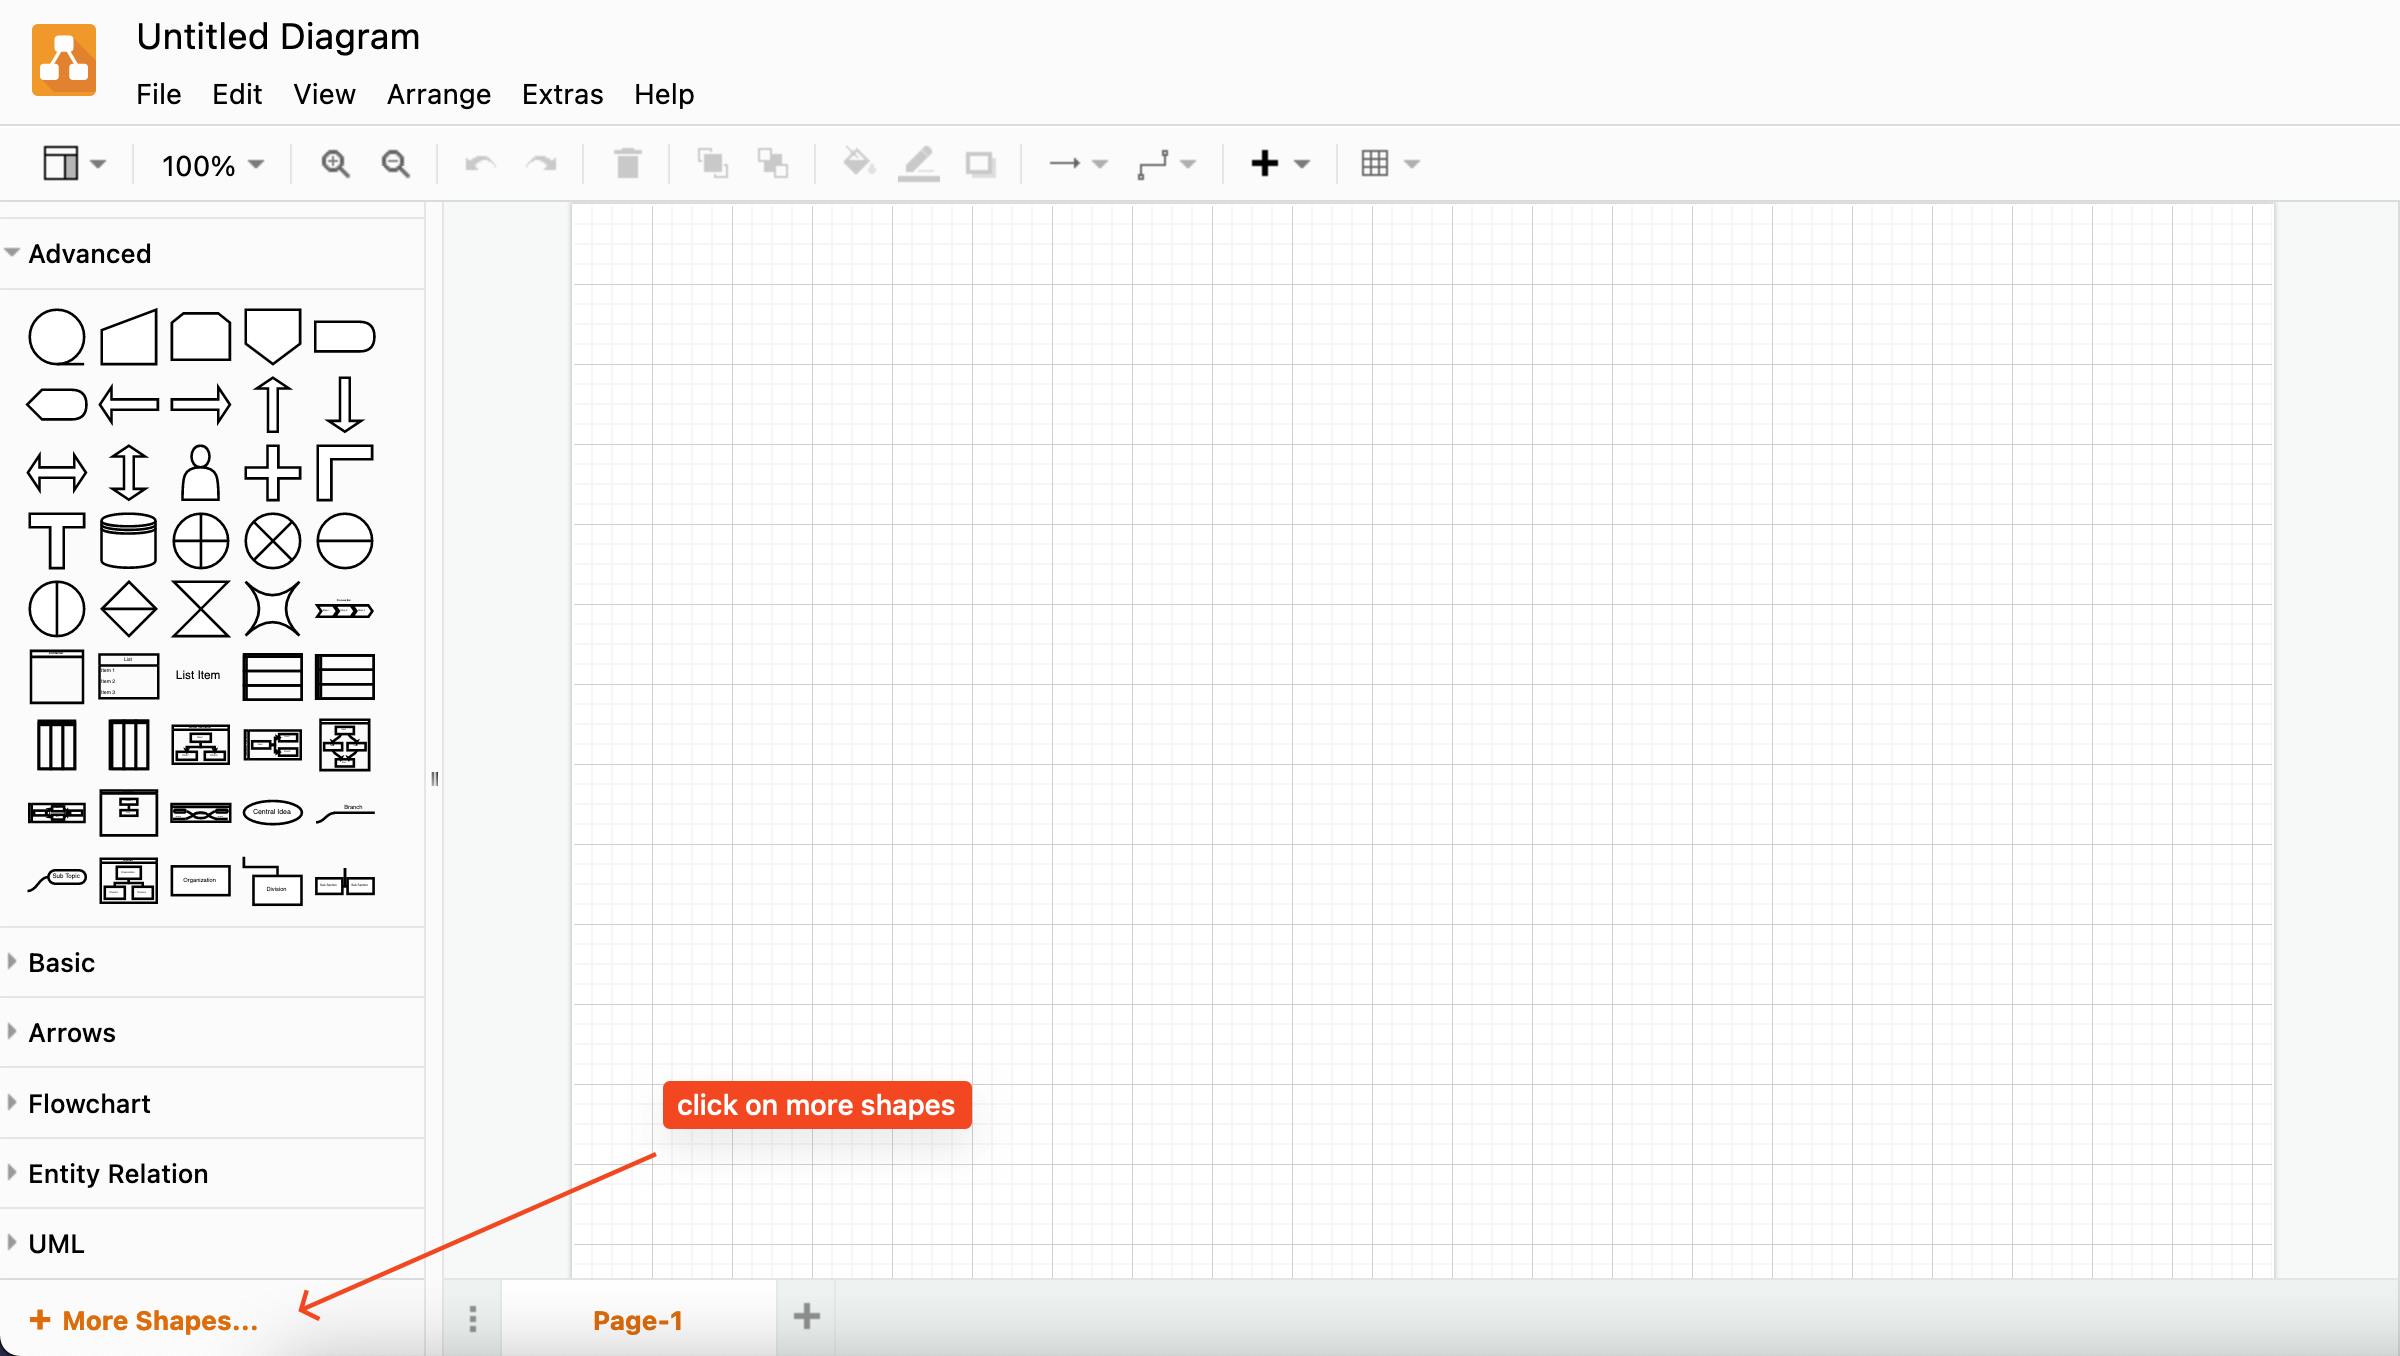
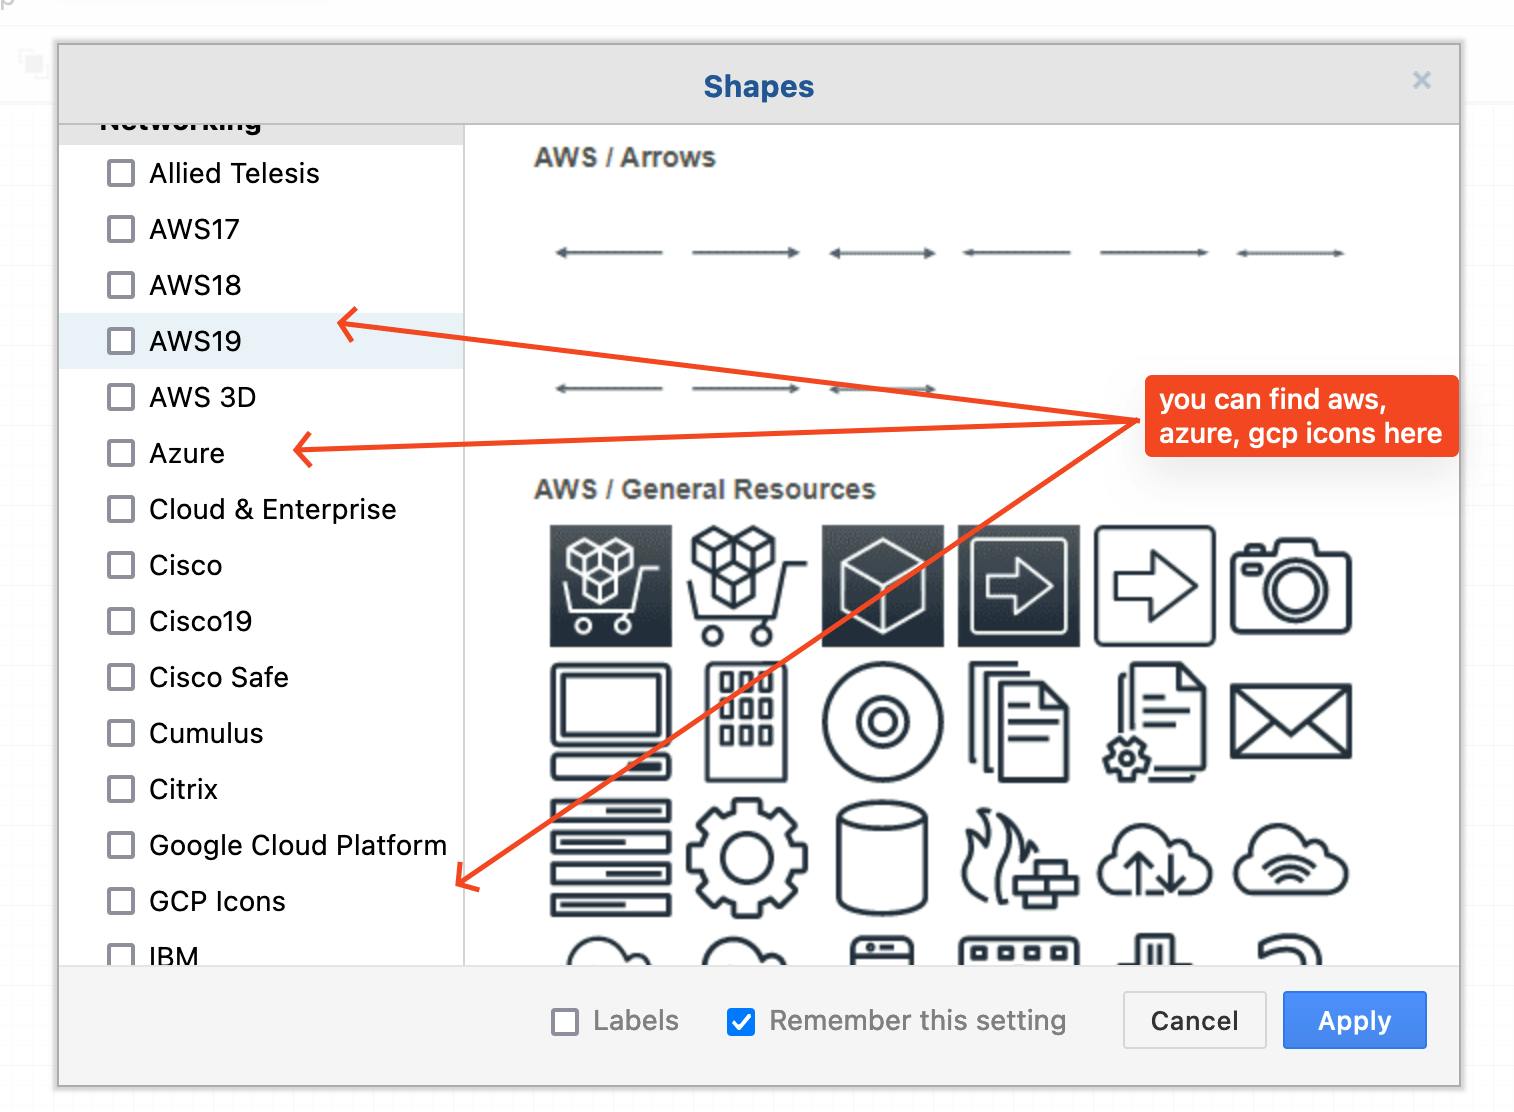
Adding extra shapes
Step 1
Click on "More Shapes"
Step 2
Browse the shapes and drag-and-drop
Lucid
Lucid.app is an ecosystem of multiple applications such as lucid chart and lucid spark for visual communication. They aimed at enterprises with paid plans, but they also have a freemium model with limited features. You can see their pricing here
Pros
- Lot of shapes and tools available
- Ease of diagramming
Cons
- Not free, most of the features require paid subscription
Adding extra shapes
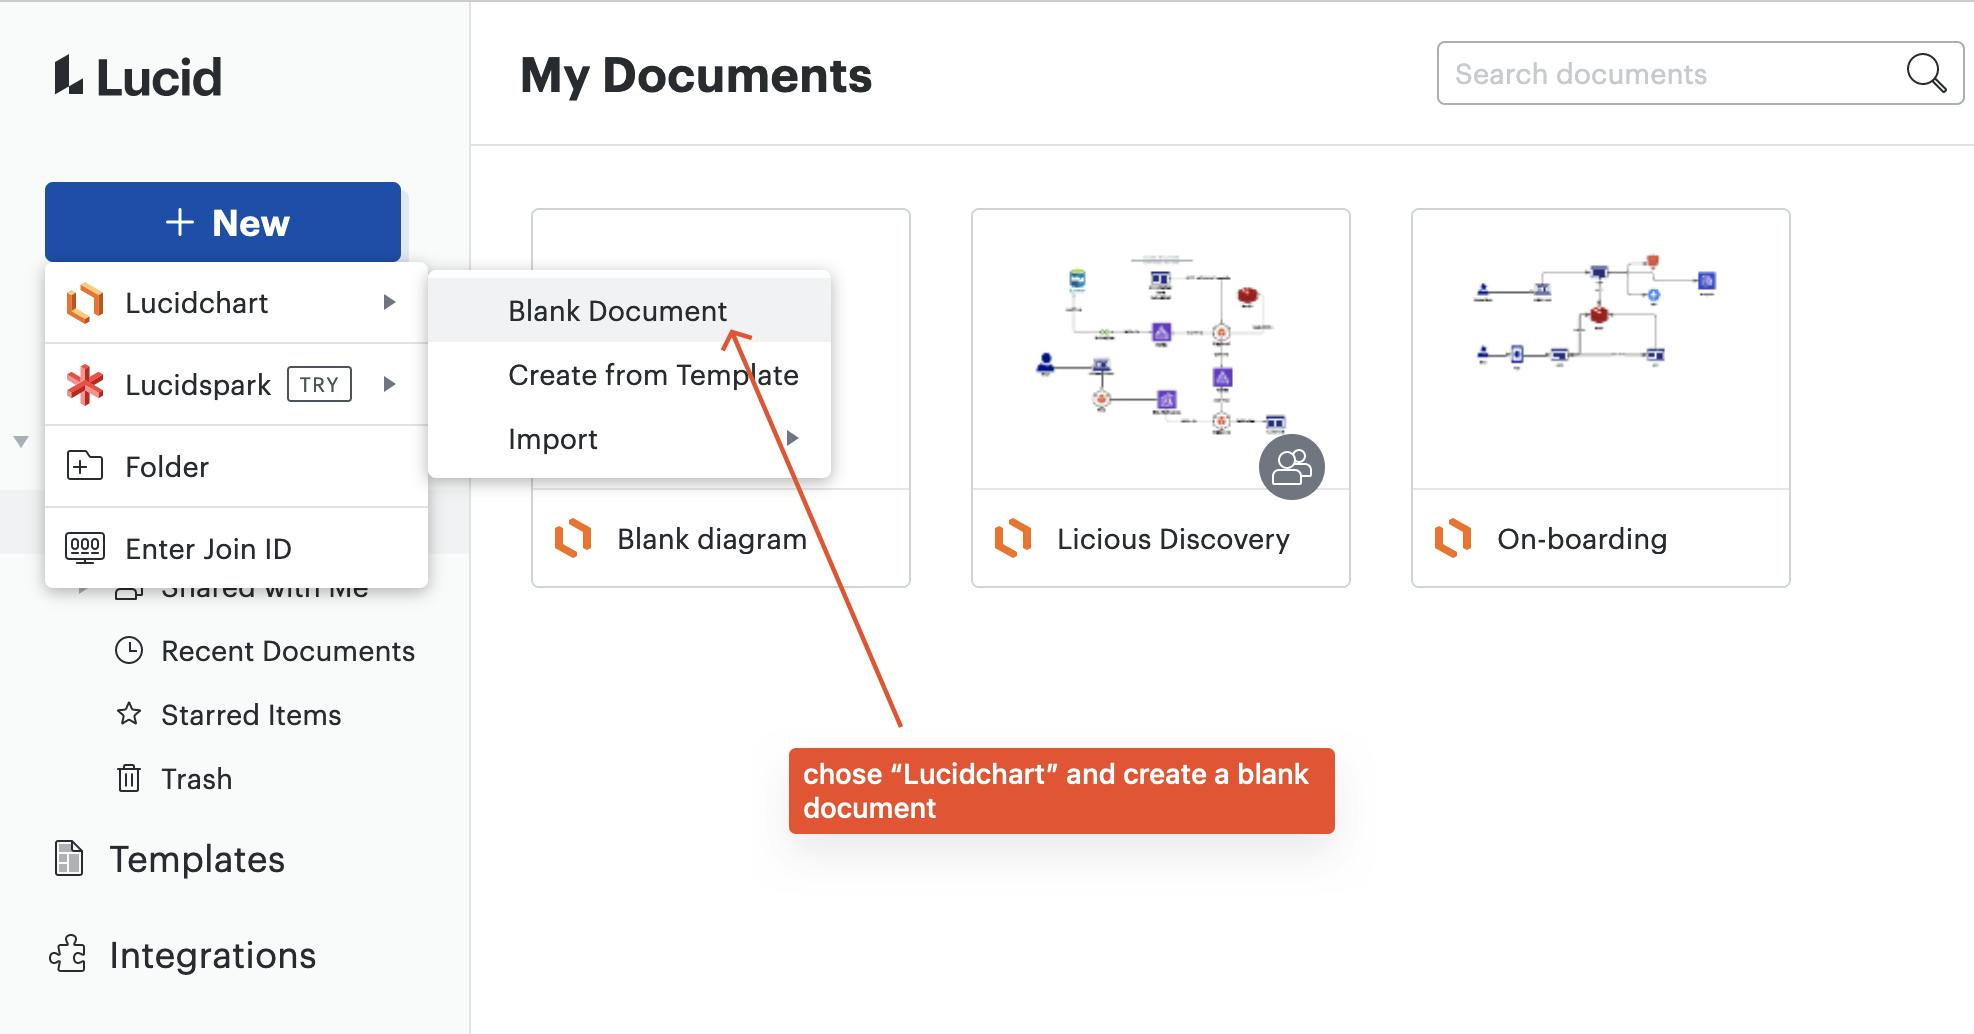
Step 1
After logging in, create a new Lucidchart document
Step 2
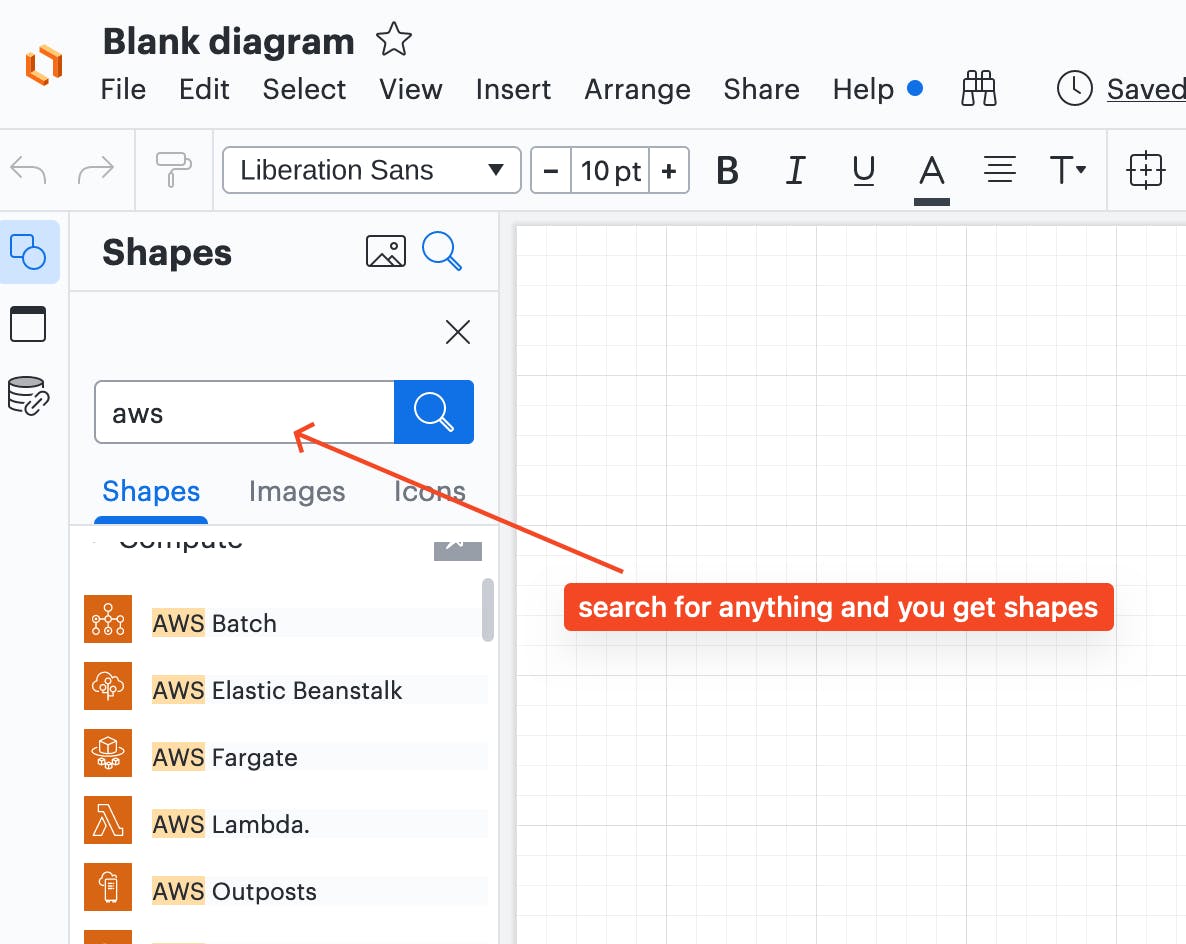
Search for a shape and add it to the diagram
Diagrams as a code
If you like to represent diagrams using code, then there are tools like Mingrammer.
Pros
- Huge availability of tools including on-premise, AWS etc...
- Easily draw diagrams
- Open-source
Cons
- Learing curve
- Supports only
python3
There are some examples given here - https://diagrams.mingrammer.com/docs/getting-started/examples
